
Jack Taylor's 138 points is the NCAA men's all-division single-game scoring record. Searches also return Frank Selvy's 100, Kevin Bradshaw's 72 and Austin Carr's 61 because each belongs to a different record category. Understanding those boundaries comes before comparing the basketball performances. This guide uses the official record books and original school accounts, with a historical-record cutoff of October 14, 2026.
The cover shows a Grinnell basketball team huddle in a school locker-room photograph published with its 2015 explanation of the System. It is not identified as the night of Taylor's record.
The single-game scoring records, by definition
Jack Taylor's 138 points for Grinnell is the NCAA men's all-division single-game record. Frank Selvy's 100 is the Division I benchmark, while Kevin Bradshaw's 72 belongs to the narrower category of points against a Division I opponent. Austin Carr's 61 is the NCAA tournament record. Those answers describe different eligible groups of games, so they can coexist.
| Record scope | Player and school | Points | Opponent and date |
|---|---|---|---|
| NCAA men, all divisions | Jack Taylor, Grinnell | 138 | Faith Baptist Bible, November 20, 2012 |
| Division I record book | Frank Selvy, Furman | 100 | Newberry, February 13, 1954 |
| Against a Division I opponent | Kevin Bradshaw, Alliant International | 72 | Loyola Marymount, January 5, 1991 |
| NCAA men's tournament | Austin Carr, Notre Dame | 61 | 1970 tournament |
The NCAA Division I record book lists Selvy and Bradshaw under separate headings. The Division III book lists Taylor's game, and Grinnell's college account identifies its significance across NCAA levels. The NCAA tournament list supplies the fourth category.
Why the opponent and competition matter
A school's place in a record book and its opponent's classification answer separate questions. A record attributed to a Division I program does not necessarily mean the game was played against another Division I team. That is precisely why the NCAA keeps the opponent-specific category. Likewise, a Division III player's NCAA achievement does not require describing the opponent as another NCAA Division III member.
Historical labels also need care. The present three-division structure dates from the 1973 reorganization described in the Division III book. Applying a modern record-book heading to Selvy's 1954 performance should not be confused with claiming that today's division structure existed that night.
Finally, tournament records restrict the competition as well as the player pool. A regular-season total cannot displace Carr on a March Madness list. Our men's tournament bracket guide explains that competition's structure. Establish the scope first, then examine the performance: shooting opportunities, conversion, extra time and opponent context become much more useful once the games being compared are clearly identified.
Frank Selvy's 100 points: the Division I benchmark
Frank Selvy reached 100 against Newberry on February 13, 1954, at Textile Hall in Greenville, South Carolina. Furman's Hall of Fame record supplies the essential scoring line: 41 field goals from 66 attempts and 18 free throws from 22. Furman won 149–95. The numbers explain the achievement much better than treating the century mark as an isolated curiosity.
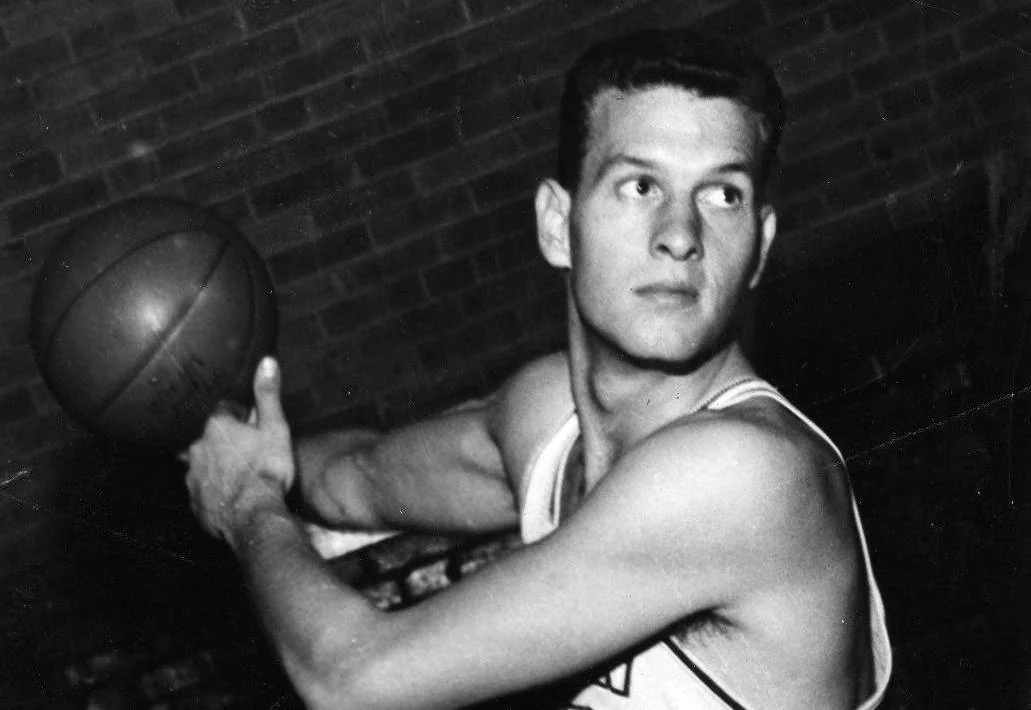
The scoring arithmetic is straightforward: 41 two-point baskets contributed 82 points, with 18 more at the line. Calculated from the recorded attempts, he shot approximately 62.1 percent from the field and 81.8 percent on free throws. Sixty-six field-goal attempts is enormous volume, but the field-goal percentage also shows sustained conversion. This was not a hundred points assembled by making a small share of an unlimited supply of shots.
The Furman record book reproduces a university magazine account of the final basket. Selvy had 98 points before taking a long running, one-handed shot as time expired. Its distance is a retrospective description, rather than a measurement from modern tracking. The shot supplied two points within that game's scoring system. Reclassifying it as a hypothetical three would change the historical result.
That feature also records 13 rebounds. They show involvement beyond shooting, but the account does not divide them into offensive and defensive categories. We therefore cannot use them to calculate how many of his attempts were generated by his own second chances. That distinction prevents a familiar mistake: using a large rebound total to invent an offensive-rebounding explanation that the original evidence cannot establish.
The game took place before a crowd of about 4,000 and was televised by WFBC, according to Furman's retrospective. Those details help explain its lasting place in the school's basketball memory. The competitive interpretation still starts with the shooting line and opponent. Selvy's hundred is the Division I record-book entry; Bradshaw's separate opponent-specific mark answers a different question. A reader who gives the second category greater weight need not diminish Selvy's conversion or erase the recorded hundred.
Kevin Bradshaw's 72 against a Division I opponent
Kevin Bradshaw scored 72 against Loyola Marymount on January 5, 1991, playing for U.S. International University, usually abbreviated USIU. The NCAA now lists the school as Alliant International. The university's official history explains that USIU merged with the California School of Professional Psychology in 2001 to form Alliant International University. The record-book label consequently should not be mistaken for the school's name during the 1991 game.
Loyola Marymount's media almanac records a 186–140 home win and Bradshaw's 72-point opponent record. Its shooting entries list 23 field goals from 59 attempts and 19 free throws from 23. Calculated from those totals, he made about 39.0 percent of his field-goal attempts and 82.6 percent at the line.
The contrast with Selvy is useful. Both carried enormous shooting volume, but the conversion profiles differ sharply. Selvy's field-goal percentage was much higher, while Bradshaw's free-throw conversion was similar. A ranking of points alone preserves the official totals without explaining how the offenses produced them. Attempts and percentages reveal a different part of the performance.
The game's two team scores add up to 326 points. That establishes an exceptionally high-scoring environment, but it does not give us an exact possession count. Missed shots followed by offensive rebounds can create several attempts within one possession. Converting the scoring total into a precise pace figure without the necessary supporting statistics would supply an impression of accuracy that the evidence does not justify.
A record performance in a losing game
USIU still lost by 46 points. Bradshaw's individual production and the team's overall performance therefore point in different directions. His 72 belongs in the NCAA opponent-specific category; that recognition does not require his team to win or imply that its offense and defense collectively outperformed LMU.
This is a reason to separate record recognition from a complete game evaluation. A scorer can shoulder an enormous offensive burden while his team loses the broader exchange of possessions. The score cannot tell us how many points a replacement would have supplied, or which defensive problems belonged to Bradshaw personally. It can tell us that an individual record and a convincing opponent victory occurred together. Keeping both facts visible is more useful than celebrating the points while hiding the result, or using the loss to declare the official record meaningless.
Jack Taylor's 138: the NCAA all-division record
Jack Taylor scored 138 in Grinnell's 179–104 victory over Faith Baptist Bible on November 20, 2012. The school's original game recap records 58 points before halftime. He reached 100 with 8:55 remaining and passed the previous 113-point NCAA mark with a three-pointer at 4:42. The final total reflects sustained production across the game, with substantial scoring still to come after reaching the century mark.
How Grinnell created so many shooting opportunities
Grinnell's explanation of its System describes a style combining full-court pressure, three-point shooting, frequent group substitutions and a commitment to involving many players. Its purpose is to create a very different game environment from a slow possession-by-possession contest. That general approach helps explain the setting, though it is not a substitute for the record game's actual statistics.
Those statistics show 49 Faith Baptist turnovers. Grinnell's box score credits the Pioneers with 63 points off turnovers and 49 second-chance points. They are team categories, not totals that can simply be assigned to Taylor. They nevertheless show two documented routes to further chances: recovering the ball from the opponent and keeping attacks alive after misses.
The team setting matters when interpreting an individual record. A shooter still has to convert, but teammates can supply the ball and recover opportunities. Grinnell's contemporary college magazine account describes both the debate over the game and the team's contribution. Recognizing those conditions adds context to the record without pretending it occurred within a conventional offensive workload.
What the box score shows about volume and efficiency
Taylor's line was 52 field goals from 108 attempts, including 27 threes from 71 attempts, plus seven free throws from ten. He played 36 minutes. Subtracting the made threes leaves 25 made two-point baskets: 50 points from twos, 81 from threes and seven at the line reconcile exactly to 138.
His field-goal percentage was approximately 48.1 percent, and his three-point percentage was about 38.0 percent. Because a made three is worth more than a made two, effective field-goal percentage offers another view of the shooting: add half the made threes to total field goals, then divide by attempts. For this line, the calculation is approximately 60.6 percent. It accounts for shot value, while excluding free throws and making no adjustment for opponent quality.
Even that stronger efficiency measure does not explain the total by itself: 108 attempts remains an extraordinary workload. Faith Baptist's David Larson also scored 70, according to the game record. The spectacular individual totals came within a game with an enormous final margin, rather than a narrow duel decided by the two scorers. A full assessment should preserve the volume, conversion and competitive setting together.
Bevo Francis and the historical small-college record
Clarence “Bevo” Francis scored 113 for Rio Grande against Hillsdale on February 2, 1954. The NCAA Division II record book retains that performance as its single-game scoring entry. Taylor's later all-division achievement did not remove Francis from this distinct historical collection.
The recorded shooting line gives the 113 a different composition from Taylor's total. Francis made 38 field goals from 70 attempts and 37 free throws from 45. Thirty-eight two-point baskets supplied 76 points; 37 at the line completed the 113. Calculated from the recorded figures, his field-goal percentage was about 54.3 percent and his free-throw percentage about 82.2 percent.
Almost one-third of his points came at the line: 37 divided by 113 is approximately 32.7 percent. Selvy obtained 18 of his 100 points there, while Taylor's line supplied seven of 138. That comparison illustrates different scoring compositions without requiring an imagined shot chart or speculation about every foul. A single headline total can hide a performance heavily influenced by free throws, one driven by made twos, or another carrying an enormous three-point component.
The division label requires historical context. The NCAA's Division II history places the adoption of the three-division structure in 1973. Its earlier university and college classifications preceded the current arrangement. Describing Francis's performance as the historical Division II record-book entry is consequently more precise than imagining a modern Division II competition structure in 1954.
The record book also explains that earlier schools could have dual NCAA and NAIA membership and statistical recognition. Its Francis season and career figures carry a specific limitation to games against four-year colleges. Those notes illustrate why eligibility boundaries belong with a record. They should be applied to the categories they actually qualify, rather than used to dismiss a separate game entry or infer a school's current membership.
Francis's 113 therefore matters both as a remarkable shooting performance and as an example of how historical record collections work. Preserve the official total and its category, examine the field goals and free throws, and avoid treating a present-day label as a complete description of the original basketball setting.
Austin Carr's 61 in the NCAA tournament
Austin Carr scored 61 as Notre Dame defeated Ohio 112–82 in the first round on March 7, 1970, in Dayton. Notre Dame's historical account identifies Ohio as the Mid-American Conference champion, entering with a 21–4 record. Those details give the game a specific competitive setting: this was a tournament matchup with a qualified opponent, rather than an exhibition or an unrestricted all-division comparison.
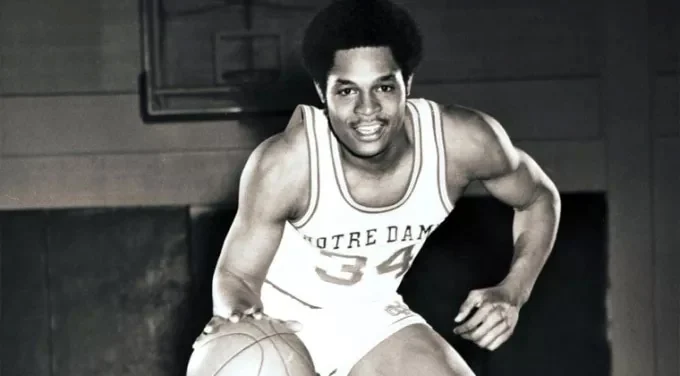
Carr made 25 of 44 field-goal attempts and 11 of 14 free throws. With no three-point line in that game, 50 points from the field and 11 at the line reconcile to the total. The calculated shooting percentages are approximately 56.8 percent and 78.6 percent, respectively. His score combined very high volume with substantial conversion, rather than needing a three-point bonus to reach the record.
The same school account gives the supporting offensive structure. Jackie Meehan recorded 17 assists, while Sid Catlett and John Pleick supplied screens in double-stack sets for Carr. That is a more concrete explanation of his opportunities than assuming every basket began with an isolated dribble move. The passer and screeners helped create the attacks; their contributions should remain visible beside the shooter's achievement. Meehan's total also cannot be assigned exclusively to Carr without a basket-by-basket assist record.
In a separate Notre Dame interview, Carr described studying defensive schemes, including box-and-one and triangle-and-two arrangements, to understand where shots would become available. His recollection helps explain his preparation generally. It does not establish that Ohio employed both defenses on the record night.
Other tournament performances need their own context
The NCAA's tournament scoring list places Bill Bradley's 58 for Princeton in 1965 and Oscar Robertson's 56 for Cincinnati in 1958 behind Carr. It also includes Carr's 52-point games in both 1970 and 1971. These entries show that the leading performance sits alongside several exceptional tournament outings, including repeated major totals from Carr himself.
The first-round designation is important. Carr's 61 should not be described as the national championship game's scoring record. Tournament-wide achievements include several rounds with different stakes and matchups. A fan comparing postseason scorers can value the total, the opponent and the stage simultaneously, while keeping the formal category intact. None of the higher regular-season records discussed earlier replaces Carr within this tournament-only list.
How to compare a scoring record without losing the basketball context
Begin with the official category, then inspect the shooting line. Points count the result; attempts describe the workload, and conversion helps explain how much the scorer obtained from that workload. The record performances above already demonstrate why those questions should stay separate. A larger total does not automatically mean a higher shooting percentage or a more demanding opponent.
Bill Walton offers a useful comparison outside the leading totals. His Basketball Hall of Fame biography records 44 points on 21 of 22 shooting in the 1973 national championship game. That total is below Carr's 61, but the field-goal conversion is approximately 95.5 percent. The final's stakes and almost perfect shooting provide a compelling performance argument without changing the tournament-wide scoring record.
Time is another essential comparison. Utah Valley's official Ryan Toolson biography records 63 points in a 123–121 quadruple-overtime win at Chicago State during the 2008–09 season. Toolson played all 60 minutes. Extra periods supplied further chances to score, while remaining part of the recorded game. Our men's game-length guide explains regulation and overtime structure.
Do not turn that extra context into an invented regulation-only result. Multiplying 63 by the ratio of regulation time to total time would assume uniform scoring across the game. It would not reveal how many Toolson actually scored before overtime. The correct comparison preserves the total and identifies the extra periods, leaving any regulation-only analysis to an actual period-by-period record.
Finally, distinguish an individual scoring achievement from a complete player ranking. Bradshaw's record occurred in a heavy defeat; Carr's came in a tournament win; Taylor's arose within an unusual shooting workload and team style. Those circumstances help explain each performance, but none supplies every answer about defense, passing or sustained career value.
When checking a new high-scoring headline, look for the scorer, team, opponent, date and competition first. Then find the original field goals, threes, free throws and minutes, and verify that the arithmetic reaches the announced total. Establish whether the claim concerns a school, division, Division I opponent or the NCAA tournament. That sequence makes the comparison concrete: it preserves the record while showing what the basketball performance actually involved.
Sign in with Google to join the discussion.