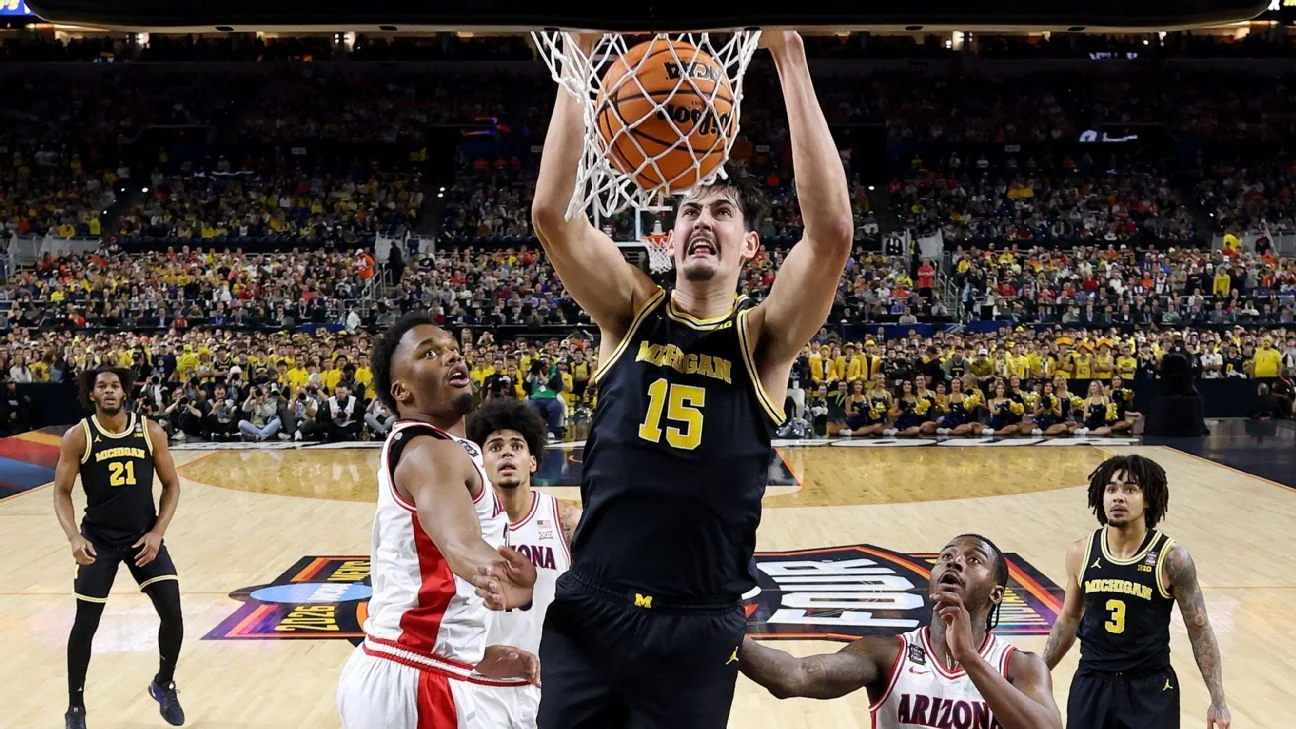
What a bracketology projection is actually predicting
College basketball bracketology forecasts which teams the NCAA selection committee will put into March Madness, how those teams will be seeded and where they may be placed. It is an interpretation of evidence and assumptions before the official decision. A team appearing in a projected field has not received a bid merely because a respected analyst placed it there.
Separate three questions when reading the page: who gets selected, what seed each selected team receives, and who wins the tournament games. The first two concern the bracket the committee builds. The third concerns performance after that bracket exists. A strong model for predicting game winners is not automatically a strong model for predicting the committee's choices.
The distinction appears even in articles using the same word. Georgia Tech's March 2026 analytics feature described Joel Sokol's LRMC approach and its prediction that Michigan would win the men's tournament. That is a championship-outcome forecast. It does not tell you how an analyst would decide the final at-large place before Selection Sunday.
By contrast, a dated field projection may discuss the evidence for a particular seed line. The Bracketeer's March 2026 notes, for example, discussed Wisconsin and North Carolina moving around the five-seed area after conference-tournament results. Those were the author's judgments about placement, not announcements from the committee. Historical examples explain the method; they are not a current projection for either program.
The NCAA's official selection overview assigns the actual selection, seeding and bracketing to the committee and says no single metric determines those decisions. Bracketologists try to anticipate that process from outside the room. Their analysis can be useful without carrying official authority.
Before comparing two forecasts, find the publication date, results cutoff and convention. Does the writer describe what the field would look like if selected today, or simulate the remainder of the season? A preseason forecast necessarily includes expectations about games not yet played. A March snapshot has much more completed evidence, but can still rely on assumptions about conference champions and unfinished games.
When the official field is released, use the confirmed bracket for opponents and locations. Our men's NCAA bracket explainer covers that next step. Before selection, treat the projected bracket as a reasoned forecast with a date, rather than a ticket to a particular regional.
Build a forecast from results, ratings and automatic bids
A responsible field forecast starts with the completed season: whom a team beat, whom it lost to, where those games were played and how the entire schedule compares with competing résumés. The analyst then identifies automatic qualifiers or states assumptions about them, compares at-large candidates and builds a seed order. Rankings inform that work; they do not replace the comparison.
Begin with verified game results and the correct season. Then inspect the distribution of wins and losses, road and neutral performance, schedule strength and relevant player availability. An isolated number becomes more meaningful when you can connect it to the games that produced it.
Résumé evidence and predictive strength do different jobs
NET is the NCAA's primary sorting tool, incorporating results-based Team Value Index and adjusted net efficiency. The official NET explanation stresses opponent quality and location and explains its role in organizing wins and losses. A NET position is not a seed assignment or a guaranteed bid.
Quadrants summarize that context. In men's basketball, Quadrant 1 covers opponents ranked 1–30 at home, 1–50 on a neutral court and 1–75 away. For an explicitly hypothetical Duke example, beating the NET No. 40 team on the road is a Q1 result; beating that same opponent at home falls in Q2. This is a venue illustration, not a claim about Duke's current schedule or an opponent's actual ranking.
Do not stop at the quadrant total. Beating the strongest opponent in a category and barely qualifying for its boundary are different evidence. The label helps organize the résumé, while the analyst still needs to read the actual wins, losses and opportunities behind it.
Results-based measures ask what the team accomplished. The NCAA's selection-criteria guide explains WAB as achieved wins minus the wins an average bubble team would expect against the same schedule. It helps compare accomplishments across schedules; it is neither a vote nor an automatic admission threshold.
Predictive systems address playing strength. KenPom's efficiency-margin explanation describes adjusted offensive efficiency minus adjusted defensive efficiency, expressed over 100 possessions. A team can perform strongly by that measure while having fewer résumé wins than another team. That disagreement calls for examination, rather than choosing whichever ranking flatters your school.
Averaging NET, KenPom and a poll ranking into one number creates your own model. It does not reproduce an official committee formula. If a bracketologist uses such a blend, evaluate the stated method and limitations rather than treating its apparent precision as proof of authority.
Automatic-bid assumptions shape the at-large field
The automatic qualifier is the team that earns its conference's bid through the conference tournament. A forecast made before that tournament is complete must choose a placeholder or simulate a winner. The writer should explain that convention. A regular-season leader shown as the projected automatic qualifier has not thereby clinched the NCAA bid.
This matters because a strong conference favorite may also merit at-large selection if it loses its tournament. A different winner can then enter through the automatic route while the favorite remains in the field through the at-large route. Forecasts that assume different conference champions can therefore produce different bubble pictures even when they agree about the favorite's strength.
Count each team once and separate its expected route from its overall seed. A projected automatic bid does not necessarily imply a low seed, and an at-large bid does not automatically imply a high one. The correct construction begins with distinct qualification routes, followed by comparison of all selected teams.

Read bubble labels as a range of possibilities
The bubble describes teams close to the at-large selection boundary whose inclusion remains uncertain. It is a comparison with other candidates, not a separate competition with its own standings. Your team can improve its case and still remain uncertain if nearby candidates also improve or the automatic-bid assumptions change.
There is no universal total of wins, losses or Q1 victories that settles every case. The NCAA's selection-myth guide rejects a magic win total and stresses current-season performance. A bracketologist's shorthand such as “needs one more win” should be read as an assessment of a particular comparison, rather than a rule every team can satisfy with the same result.
Last teams in and first teams out describe a cutoff
“Last in” generally means the writer places those at-large candidates just inside the projected field. “First out” identifies the strongest excluded candidates in that forecast. These labels help readers see the boundary, but the writer should explain whether a list is ordered and how it relates to projected seeding.
Being first out does not establish a measurable admission probability. One analyst may see a narrow gap, while another puts the same team further away because of a different résumé comparison or automatic-bid assumption. Even broad agreement among forecasters is agreement about an estimate, not a committee vote.
Use the explanation beside the label. Which quality wins support the case? Which losses or schedule weaknesses create doubt? How does the team compare with the actual candidates around the boundary? A useful bubble discussion answers those questions instead of treating a large conference name or a famous program's history as its evidence.
Timing also matters. A forecast posted before Saturday's games is evaluating a different set of results from one updated afterward. A move across the cutline may reflect new evidence about a competitor. It need not mean the analyst suddenly changed an opinion about your school's most recent game.
Bid thieves can change the picture without your team playing
A bid thief is a conference-tournament winner that would otherwise fall outside at-large selection. The NCAA's bubble explanation describes how this can squeeze the projected boundary. The winner receives an automatic bid. If the favorite it replaces still merits an at-large bid, the field must accommodate both teams.
The allocation of at-large places itself does not shrink; the demand for those places increases. In a hypothetical league, a forecast might initially give its strong favorite the automatic bid. An outsider then wins the conference tournament, while the favorite stays selected at large. The extra entrant changes who fits at the edge, even if a bubble team elsewhere has already finished playing.
NC State offers a real historical example of an unexpected automatic route. The ACC's 2024 championship report records the Wolfpack's five wins in five days and 84–76 final win over North Carolina. That run demonstrates why conference-tournament assumptions need revision. It does not prove which individual excluded team would have been selected under an alternative result.
Follow today's games with those relationships in mind. Watch your team's opportunities, nearby at-large competitors and relevant conference finals. A championship-week win adds evidence through its opponent and location; it does not receive a special weight simply because it happened in March.

Why seed lines and regional placements remain separate judgments
A forecast can be convincing about a team's inclusion while leaving considerable uncertainty about its seed. Selection asks whether that résumé belongs in the field. Seeding compares it with the other selected teams. Placement then turns that ordered assessment into particular regions, sites and opponents. Reading those as separate judgments helps you identify what two bracketologists actually disagree about.
The NCAA's selection and seeding explanation describes an overall seed list followed by bracket construction. The men's placement rules account for conference rematches, geography and regional balance. Those constraints help explain why reproducing a published bracket requires more than sorting teams by a single rating. A projected region is another layer of a writer's prediction; its tidy appearance does not make the decision final.
Consider a hypothetical comparison in which two forecasts both place Duke on a No. 5 seed line but put it in different regions. They may broadly agree on its résumé while differing about surrounding teams or how placement constraints will be resolved. Now consider one writer moving Duke from a fifth seed to a sixth seed after new results. That is a change in the writer's relative assessment, but it still does not necessarily indicate concern about Duke missing the field. Neither example describes an announced 2027 assignment.
Start by comparing projected inclusion, then seed line, then region and opponents. This order prevents a visually dramatic map change from overshadowing a relatively small change in evaluation. Ask the author whether a move reflects a new result, another team's improvement or a placement adjustment. If the explanation is missing, treat the displayed destination as provisional rather than inventing a basketball reason for it.
The official men's procedures also provide a useful standard when evaluating forecasts after the reveal: compare field accuracy, seed accuracy and placement accuracy separately. Getting a team into the right field answers a different question from putting it in precisely the right region. For planning, enjoy an attractive projected matchup and save it as a scenario. Make commitments tied to an actual destination only when the official assignment establishes where your team will play.
Use the correct field size for the 2027 tournament
The 2027 men's NCAA tournament has a 76-team field: 32 automatic qualifiers and 44 at-large teams. Those are the current allocations stated in the official men's selection procedures. The NCAA's May 2026 expansion announcement establishes when the change begins. An older 68-team projection can illustrate its own season, but it is the wrong capacity for a forecast of the 2027 championship.
Check the tournament year before comparing bubble lists. A writer who has updated the headline but retained an old field template may be excluding teams simply because the template has too few places. Conversely, more places do not make a particular school safe. The relevant question remains how that school's evidence compares with the other eligible candidates under the correct allocation.
What the expanded Opening Round changes
The new Opening Round includes the 12 lowest-seeded automatic qualifiers and the 12 lowest-seeded at-large teams, producing 12 games among 24 participants. Its 12 winners join 52 teams that advance directly to the round of 64. These opening participants already belong to the selected tournament field. Their additional game determines who advances, rather than whether they receive a bid.
Pay particular attention to the words “lowest-seeded.” A committee's seed-list ordering is not the chronological order in which teams were selected. A forecast can therefore discuss a team comfortably making the field while still projecting it into the Opening Round. For fans, making the tournament and avoiding that extra game are two different questions to ask of the same bracket.
The NCAA's July 2026 update confirms Dayton and Wichita as the men's Opening Round hosts, with games on March 16 and 17, 2027. A projected opening opponent or destination still depends on the actual seed list and placement. Use the confirmed assignment and our college basketball calendar when turning a forecast into a viewing plan.
Entering at the opening stage also does not settle how far a team can go. The NCAA's expansion guide recalls UCLA reaching the Final Four from the First Four in 2021. That is a dated example from the previous format, not a prediction for UCLA in 2027. It is a reminder to distinguish a forecast of the starting position from a forecast of tournament performance.
Follow bracketology without treating every update as a verdict
A useful bracketology habit is to record a few details alongside each forecast: author, timestamp, completed-results cutoff, tournament year, automatic-bid assumptions and your team's projected position. This is a reading method, not an NCAA selection formula. It gives you a consistent basis for deciding whether today's update changed the analysis or simply caught up with yesterday's games.
A dated example shows why those details matter. The Bracketeer's February 27, 2026 board listed California and Ohio State as new projected at-large teams in the First Four. Preserve the date and attribution when discussing that label: it described one writer's assessment then. Its 68-team template belongs to the 2026 tournament, while a 2027 comparison requires the expanded format.
When comparing current writers, first align their cutoff times and forecast conventions. Two pages may disagree because one has processed a late road win and the other has not. They may also assign different provisional conference champions. After those differences are accounted for, ask which résumé comparison produces the disagreement. A list of names alone gives you less information than an explanation of the evidence separating the final candidates.
Save a brief change log in ordinary language: new result, stronger opponent résumé, revised automatic-bid assumption, or revised relative seeding. If nothing identifiable changed, avoid attaching a large significance to a one-place movement. Check completed results on our men's college basketball scores page before assuming every forecast has incorporated the same games. Agreement across several writers can help identify a commonly held assessment, but it does not supply a mathematically justified admission probability.
The NCAA's selection guidance emphasizes the whole current-season body of work. Keep early results in the comparison rather than replacing them with a memorable March performance or a program's reputation. The question worth carrying into the next game is concrete: what result, opponent comparison or automatic-bid outcome could change this forecast? That makes bracketology useful for following the season while leaving the actual selection decision with the committee.
Sign in with Google to join the discussion.