Which season does a 2026 conference ranking describe?
For the 2025-26 season, WarrenNolan's archived conference NET presentation places the SEC first, followed by the Big 12 and Big Ten. That is a useful answer to one version of the question. It is not a forecast of the 2026-27 season, an official NCAA conference poll, or a statement that every SEC team would beat every opponent from the other leagues. Start with the season and the measurement before debating the order.
This comparison uses the archive's March 15, 2026 NET snapshot. The season has since finished, but the archive identifies its NET section with that March date and separately labels its final polls April 7. Calling those two lists the same final ranking would mix evidence from different moments. Here, the completed season supplies the historical context; the numerical conference table represents the specified March snapshot, before the NCAA tournament played out.
A conference comparison also differs from a team ranking. The NCAA describes NET as a team evaluation tool that accounts for efficiency, results, opponent quality and game location. A publisher's conference table organizes the league picture around that ecosystem. It does not replace the individual team evaluation used for selection. A strong league label gives context to an opponent, while that opponent's actual performance remains the more relevant evidence for a particular game.
As of October 20, 2026, the next regular season still belongs to a separate discussion. Preseason expectations can reflect new players, coaching decisions and changed membership. Those are reasons to reconsider the hierarchy, not reasons to relabel last season's results as new-season measurements. Keep a historical comparison and a preseason forecast in separate columns mentally, even when both appear in an argument about the calendar year 2026.
The practical question is therefore specific: which conference looked strongest under the named March measure, and what does that tell us about the games its teams played? Once that question is clear, disagreements become more productive. One fan may care most about the strongest title contender; another may care about the typical road opponent. Both can use the same evidence and reach different judgments because they are measuring different parts of league strength.
The 2025-26 NET conference comparison
The table below reproduces the leading ten leagues in WarrenNolan's 2026 conference NET presentation, using the March snapshot identified above. The accompanying percentage concerns nonconference games against Division I opponents. It is descriptive context rather than the definition of the conference order. That distinction is visible immediately: the league with the best percentage is not first in the ranking.
| Conference order | League | Nonconference win percentage |
|---|---|---|
| 1 | SEC | .7585 |
| 2 | Big 12 | .8010 |
| 3 | Big Ten | .7919 |
| 4 | ACC | .7639 |
| 5 | BIG EAST | .7190 |
| 6 | Mountain West | .6281 |
| 7 | Atlantic 10 | .6467 |
| 8 | West Coast | .5957 |
| 9 | Missouri Valley | .5701 |
| 10 | American | .5298 |
Read the headings literally. Nonconference wins capture different schedules, locations and opponents. A league can improve that percentage by beating more manageable opponents without making the same statement as a collection of difficult road victories. The percentage should prompt an examination of the schedule, not close the discussion. Likewise, a conference's highest-ranked team represents its top end; it does not describe the difficulty of its middle or lower positions.
Average rank describes one part of league strength
The displayed conference page does not explain its aggregation formula, so this article does not claim that its order is a simple arithmetic average. If you build your own average from a team list, label that calculation separately. A hypothetical league with ranks 10, 30 and 80 has an average rank of 40. Another with ranks 35, 40 and 45 also averages 40. The same average can conceal very different distributions and very different best teams.
Rank is an ordering, not a point spread. The gap from tenth to twentieth need not represent the same difference in playing strength as the gap from hundredth to hundred-and-tenth. An average of positions is therefore a compact summary with limits. For a fuller comparison, inspect the median team, the weakest opponents and the concentration near the top, then return to actual team efficiency and results. Those checks explain what a headline conference order can hide without pretending to reverse-engineer an unpublished formula.
Compare the leading conferences beyond their order
The top-three order points toward a strong SEC, Big 12 and Big Ten, but selection results offer a second comparison. The SEC sent ten men's teams to the 2026 NCAA tournament, the Big Ten nine and the Big 12 eight. That evidence supports substantial competitive breadth across all three. It does not prove that the three league profiles were identical, nor that the conference ranking predicted the eventual champion.
Depth and the strongest teams answer different questions
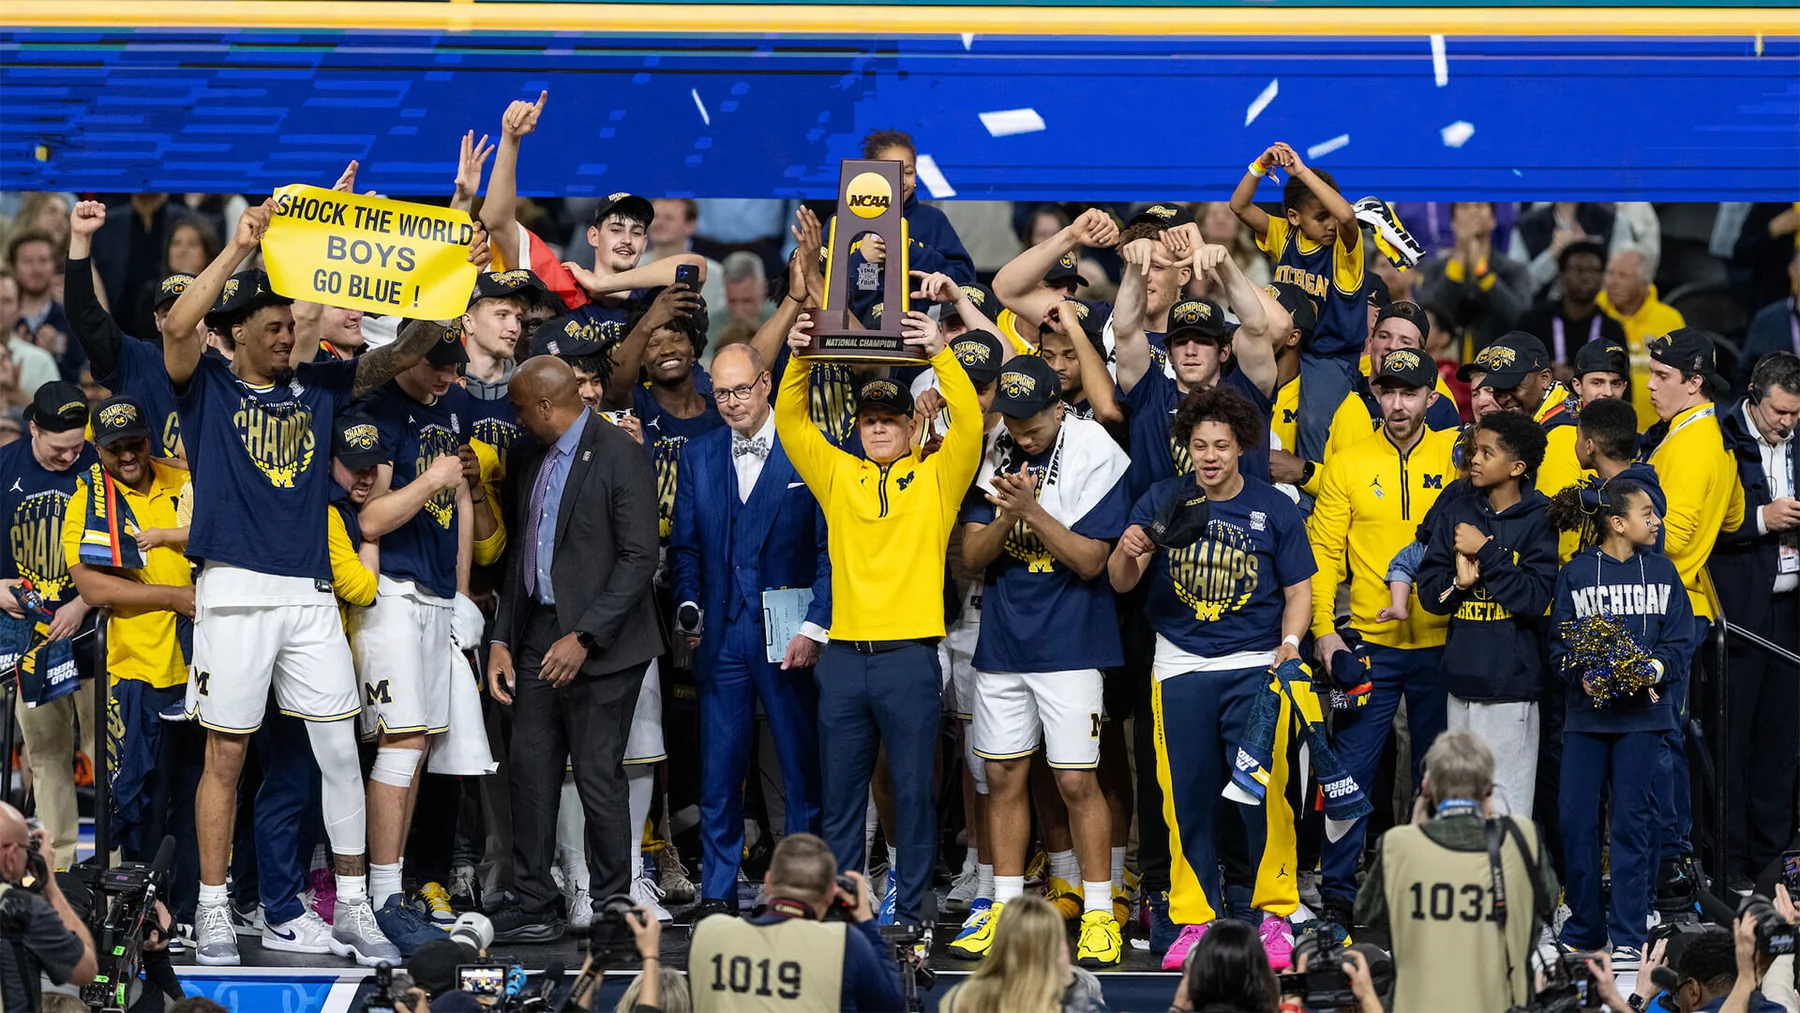
A contender-focused comparison asks how dangerous the best teams are on a neutral floor. A depth-focused comparison asks how often an ordinary conference night presents a difficult opponent. The NCAA tournament adds a third test involving selection, seeding and successive matchups. Those tests overlap without being interchangeable. The Big Ten's Michigan won the national championship, while the SEC's broader tournament contingent finished with a 14-10 NCAA record. Neither fact retroactively changes what the dated conference table measured.
Consider how this changes a preview. If a favorite has recently faced several strong defenses, its modest scoring average may say more about opposition than about its ceiling. Yet a league's reputation cannot supply the missing possession-level evidence. Check whether those specific opponents forced turnovers, protected the rim or limited second chances. Describing a conference as deep is useful only when it guides the reader toward the actual teams responsible for that depth.
Conference size changes the comparison
The 2025-26 SEC and Big 12 each had sixteen teams; the Big Ten had eighteen. The bid counts therefore translate to selection shares of 62.5 percent, 50 percent and 50 percent respectively. These are straightforward calculations from membership and selections, not a new predictive model. They make the scale of each contingent easier to compare while leaving the quality of its best and least successful teams unresolved.
An expanded league can accumulate more ranked teams or wins simply because it contains more programs. A smaller league can have fewer selections while sending a larger fraction of its membership. Use totals when discussing how many national games a conference supplied, shares when discussing breadth relative to size, and individual profiles when judging a matchup. For the upcoming SEC slate, the SEC schedule helps turn an abstract reputation into named opponents, locations and recovery windows. The games on that calendar still need to earn the new season's judgment.
Where the ACC, BIG EAST and other challengers fit
The ACC and BIG EAST occupied fourth and fifth in the conference snapshot, but their selection profiles differed considerably. The ACC earned eight NCAA bids, including the overall first seed Duke. The BIG EAST earned three, through UConn, St. John's and Villanova. The conference order alone conceals that gap in selection breadth. It also conceals the difficulty of facing a high-level opponent from a league with fewer bids.
UConn received a regional second seed. That is a concrete reminder that fifth in a conference comparison does not translate to fifth-tier basketball at the top. A national contender can emerge from a league whose broader selection footprint is smaller. Conversely, the ACC's eight bids should lead to a discussion of those eight individual resumes, rather than an assumption that each carried Duke's strength. Attach the evidence to the team before carrying it into a head-to-head argument.
The next group is equally instructive. Mountain West, Atlantic 10 and West Coast occupied sixth, seventh and eighth. Yet their highest NET teams were Utah State at 26, Saint Louis at 31 and Gonzaga at seven respectively. The West Coast therefore supplied a higher-ranked leading team than either league immediately above it. This is a particularly clear case of why the strongest member and the conference-wide position answer different questions.
For a viewer choosing between games, that distinction matters. An elite team playing outside the five highest-ranked leagues may offer stronger basketball than an ordinary matchup inside them. For a resume discussion, the opponent's actual ranking and game location matter more than whether a conference is commonly called a power league. Conference context can help identify overlooked games; it should not become a shortcut that dismisses those games without looking at the teams.
The BIG EAST schedule supplies another practical check: which opponents does a team actually face, and where? A difficult away fixture can be hidden behind a league's aggregate position. Treat each conference as a distribution with a recognizable top, middle and lower end. A comparison that acknowledges those layers can credit the ACC's wider selected group, the BIG EAST's dangerous leaders and Gonzaga's exceptional historical position without forcing all three observations into a single slogan.
What changes for the 2026-27 preseason
The most obvious structural reason to revisit the historical order is the new Pac-12. Gonzaga joined on July 1, 2026, alongside Boise State, Colorado State, Fresno State, San Diego State, Texas State and Utah State. They joined Oregon State and Washington State in a nine-member league. Gonzaga's strong historical rank no longer belongs to the current West Coast membership, and several programs that supplied Mountain West strength now compete elsewhere.
There is concrete retrospective evidence for taking the new group seriously. In its July launch announcement, the Pac-12 reported a five-season average NET position of 91.1 across its new membership, compared with 89.9 for the ACC. It also reported six of its nine men's programs with a top-100 average in that period. These are the league's historical membership-adjusted comparisons. They are not a 2026-27 NET ranking, and they do not establish that this season will reproduce those averages.
Membership and rosters require a fresh evaluation
A new league comparison must first assign the right programs to the right conference. It must then inspect the actual rosters. Historical team strength cannot be transferred intact through graduating players, incoming recruits and transfers. A returning coach may preserve a defensive approach while asking a different guard to run the offense. That distinction matters more to an early forecast than an old league average stated to a decimal place.
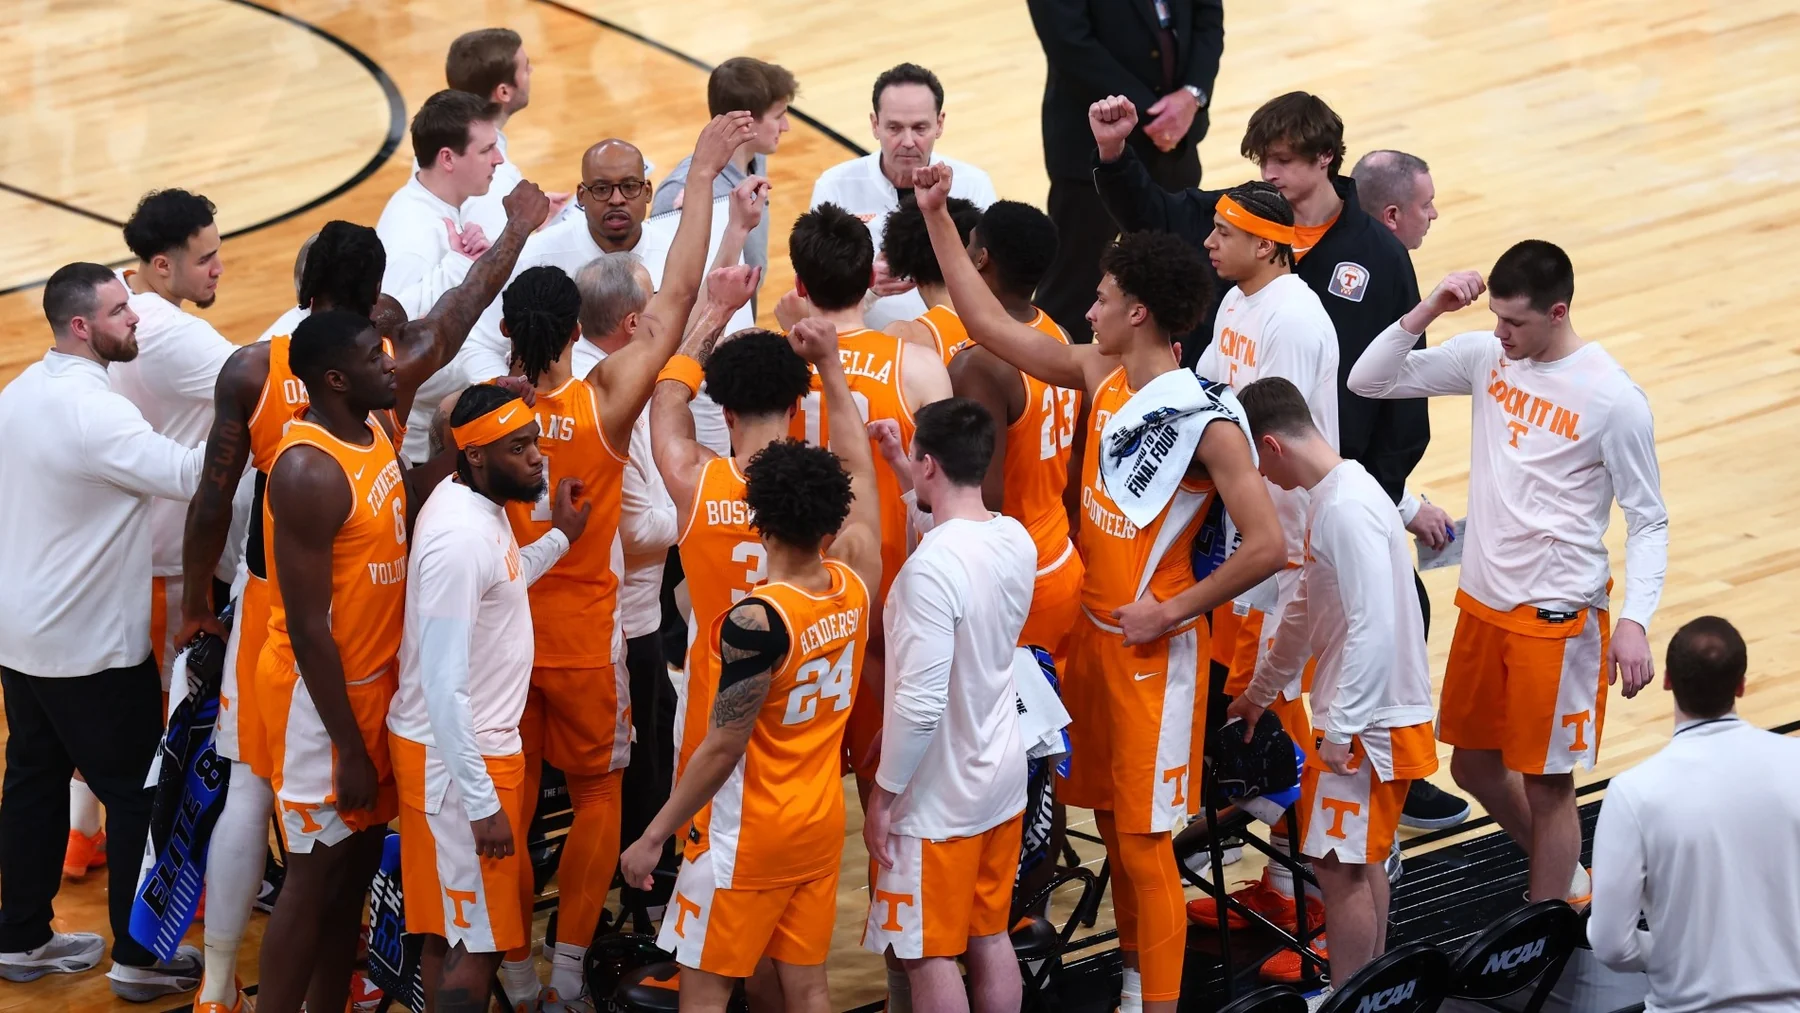
Preseason polls require the same attention to scope. Tennessee was picked fourth in the SEC's media forecast released in October. That is a prediction about Tennessee's position inside one conference, not a claim that the SEC ranks fourth among conferences. Confusing those labels creates an answer to a different question. A national team poll, a conference preseason poll and a league-strength model can all be useful when their targets are identified correctly.
For a responsible outlook, retain the SEC, Big 12 and Big Ten as the historical leading group under the March measure, then investigate what changed rather than awarding them a frozen new-season order. Evaluate the ACC and BIG EAST through their current teams, and treat the reshaped Pac-12, Mountain West and West Coast as fresh comparison problems. Early games can test those expectations. Until they do, a forecast should explain its roster and membership assumptions instead of borrowing the authority of a dated NET table.

Turn a conference ranking into better game analysis
Use league strength to choose the next question, then let team evidence answer it. Michigan's 95-62 win over Tennessee in the March 29, 2026 Elite Eight supplies a clear example. The Big Ten team beat an opponent from the league placed higher in the conference snapshot. That result makes sense once the comparison returns to individual teams. A league order was never a promise about every possible pairing.
The box score gives the discussion firmer ground: Michigan made ten three-pointers and twenty-seven free throws. Those categories describe how the winners accumulated points; they do not, by themselves, explain every cause of the margin. To understand the game more fully, examine the possessions that produced the attempts, the defensive coverage and who was available to execute it. That is a more useful basketball conversation than treating the score as proof that an entire conference order was wrong.
Before a new matchup, establish the season, the ranking date and the location. Then compare the actual opponents on each resume. A team can have a similar record to another while reaching it through a different mix of home games, difficult road trips and neutral-site tests. The NCAA's selection explanation treats several kinds of evidence together. A single conference position cannot recreate that evaluation or guarantee how a committee will judge one team's season.
Next, look for an on-court problem that travels beyond league boundaries. Can the ballhandlers protect possession against pressure? Can a defense finish with a rebound after forcing a miss? Does the lineup have enough shooting to punish help around the rim? These are questions to investigate through current statistics and film, not characteristics automatically inherited from a conference badge. They make cross-conference games especially valuable because a new opponent can expose a weakness that familiar league opponents did not test in the same way.
Finally, use the games today page to identify actual tests and the scores page to follow the outcomes. Keep your conclusion proportional to the sample. One striking win can change a team assessment faster than it changes a league-wide judgment. The historical table remains a dated starting point; the new season's comparison should grow from the teams, opponents and possessions that actually occur.
Sign in with Google to join the discussion.